Chapter 7 Osprey basis set tools
Being a linear-combination modelling software, Osprey requires prior spectral knowledge in the form of so-called basis sets. These are collections of model spectra (basis functions) for the various metabolites you wish to quantify.
Historically, basis functions were acquired experimentally from aqueous solutions, which was a laborious and often incredibly frustrating task. Fortunately, many free software solutions open up a world of simulating any NMR experiment, and can generate noise-free model spectra of most of the spin systems we could be interested in.
In this chapter, you will learn how to generate an Osprey basis set. You can either import an existing complete basis set in LCModel format (.BASIS), or you can compile an Osprey basis set from a set of synthetic spectra that have been simulated using the FID-A software. Please refer to the example scripts in the repository for directions and how to do this. You can also ask for advice in the Spectral Simulation and Basis Sets categories of the MRSHub forum.
7.1 io_LCMBasis
If you have an existing LCModel basis set (.BASIS), you can import it into Osprey. Assuming the basis set is located at /Users/Georg/LCModelBasissets/GE/press144, you can execute the following command at the MATLAB prompt after you have run OspreyJob:
You can then call Osprey’s io_LCMBasis function to create a basis set:
Follow the instructions in the MATLAB prompt, and from then on, OspreyFit will automatically pick this basis set, but only if there is no internal existing Osprey basis set with matching parameters. We will soon provide the option to specify an individual basis set in the job file.
7.2 fit_makeBasis
For the purpose of this tutorial, we will assume that you have a set of FID-A simulations saved in a folder on your hard drive. Your folder may look like this:
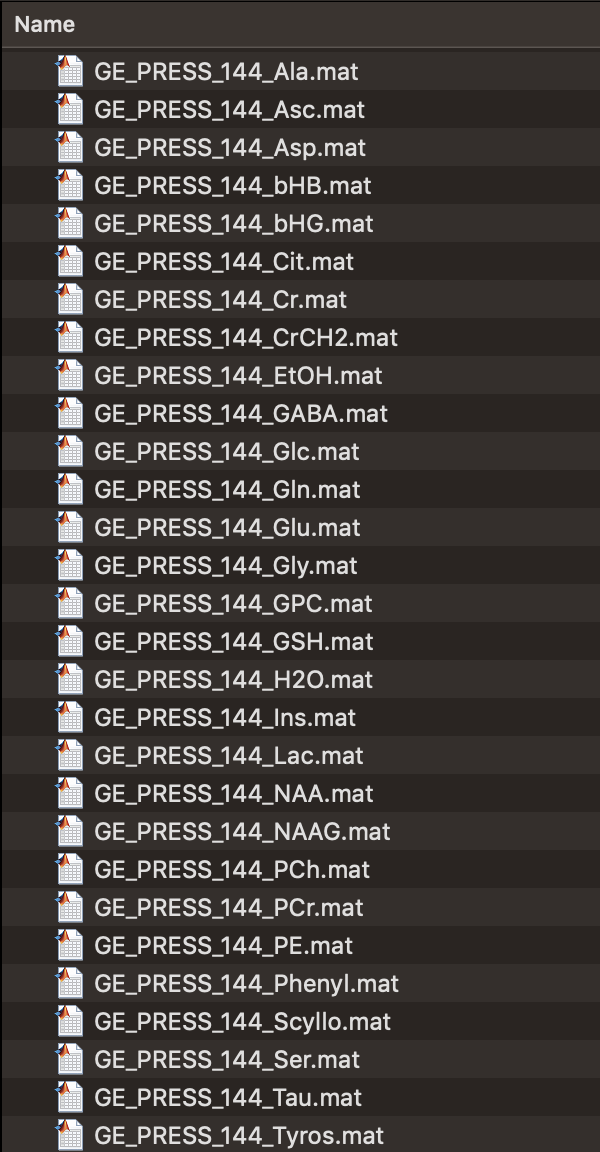
Figure 7.1: A folder full of FID-A simulations.
In this case, we have simulated a bunch of metabolites for the GE PRESS sequence at an echo time of 144 ms.
If this folder is located at, say, /Users/Georg/MRS_Simulations/GE/press144, you can create a variable called folder at the MATLAB prompt:
You can then call Osprey’s fit_makeBasis function to create a basis set:
This will generate a struct array called BASIS in the MATLAB workspace, and also save it to the current MATLAB working directory. This file is your new Osprey basis set. If the addMMFlag argument (see below) is set to 1, the filename of the basis set is going to be BASIS_MM.mat; if it is set to 0, the filename will be BASIS_noMM.mat.
7.2.1 Complete syntax
Inputs
| Input | Type | Description | Mandatory? | Options |
|---|---|---|---|---|
| folder | String | Complete path to the folder containing .MAT files with FID-A-simulated metabolite basis functions |
Yes | — |
| addMMFlag | Boolean | If set to 1 (default), Osprey will automatically add macromolecule and lipid basis functions to the basis set |
No | 1 (default), 0 |
| sequence | String | Determines the type of sequence that you want to create a basis set for. Will try to automatically determine the order of editing steps from saturated NAA and water signals. | No | 'unedited' (default), 'MEGA', 'HERMES', 'HERCULES' |
| editTarget | String | Determines the target molecule(s) of the editing experiment. Only needs to be set if sequence is set to something other than 'unedited'. |
No | 'GABA' (default), 'GSH' |
7.3 fit_plotBasis
Once you have generated the basis set, you may want to plot the basis functions and inspect that they look like you expect them to. For this purpose, Osprey includes a function called fit_plotBasis.
fit_plotBasis acts on the contents of an Osprey .MAT basis set file. If you load any basis set into MATLAB by double-clicking on it, you will see the struct BASIS in the MATLAB workspace:
Figure 7.2: An Osprey basis set after loading into MATLAB.
You can then call fit_plotBasis to create a plot overview of the basis set:
This command will generate a stack plot of all basis functions (including macromolecules and lipids, if you have chosen to include them in the basis set) along with a ppm axis:
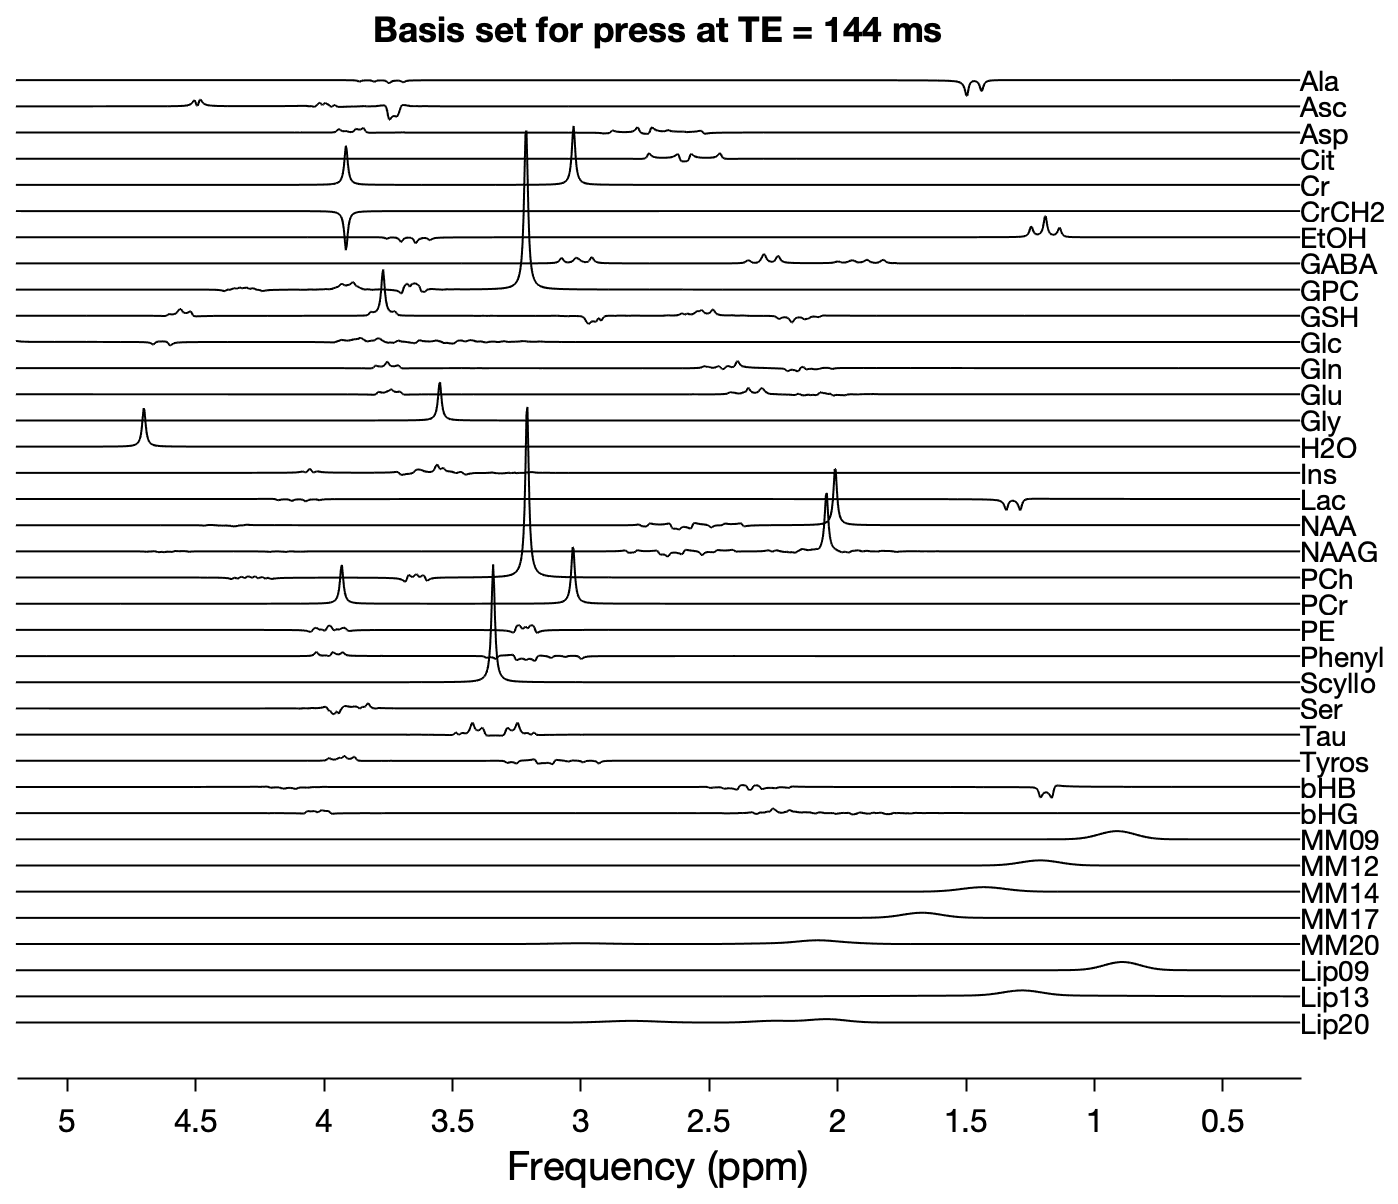
(#fig:ospreyFit_plotBasis)Output from fit_plotBasis.
7.3.1 Complete syntax
Inputs
| Input | Type | Description | Mandatory? | Options |
|---|---|---|---|---|
| basisSet | String | Name of the struct in the MATLAB workspace containing the Osprey basis set (usually BASIS) |
Yes | — |
| dim | Integer | Dimension of the basis function that you want to plot. For unedited data, this will be 1. MEGA-edited data will have the off spectrum in dimension 1, the on spectrum in dimension 2, the difference spectrum in dimension 3, and the sum spectrum in dimension 4. |
No | Default: 1 |
| stagFlag | Boolean | Determines whether basis functions are plotted vertically staggered or simply on top of one another. | No | 1 = staggered (default), 0 (not staggered) |
| ppmmin | Float | Lower limit of ppm axis to plot. | No | Default: 0.2 |
| ppmmax | Float | Upper limit of ppm axis to plot. | No | Default: 5.2 |
| xlab | String | X-axis label | No | Default: 'Frequency (ppm)' |
| ylab | String | Y-axis label | No | Default: '' |
| figTitle | String | Figure title | No | Default: '' |